- Data Visualization Aggregator
Datavisualization.ch is the news and knowledge resource for data visualization and infographics. Their mission is to provide us with the latest research findings and most topical use cases in this field – including cognitions from self initiated studies as well as a review of outstanding projects done by smart people in the community. It is also a perfect place to share your opinion and discuss interesting movements, to get inspired and ignite new ideas.http://datavisualization.ch
- A visualization
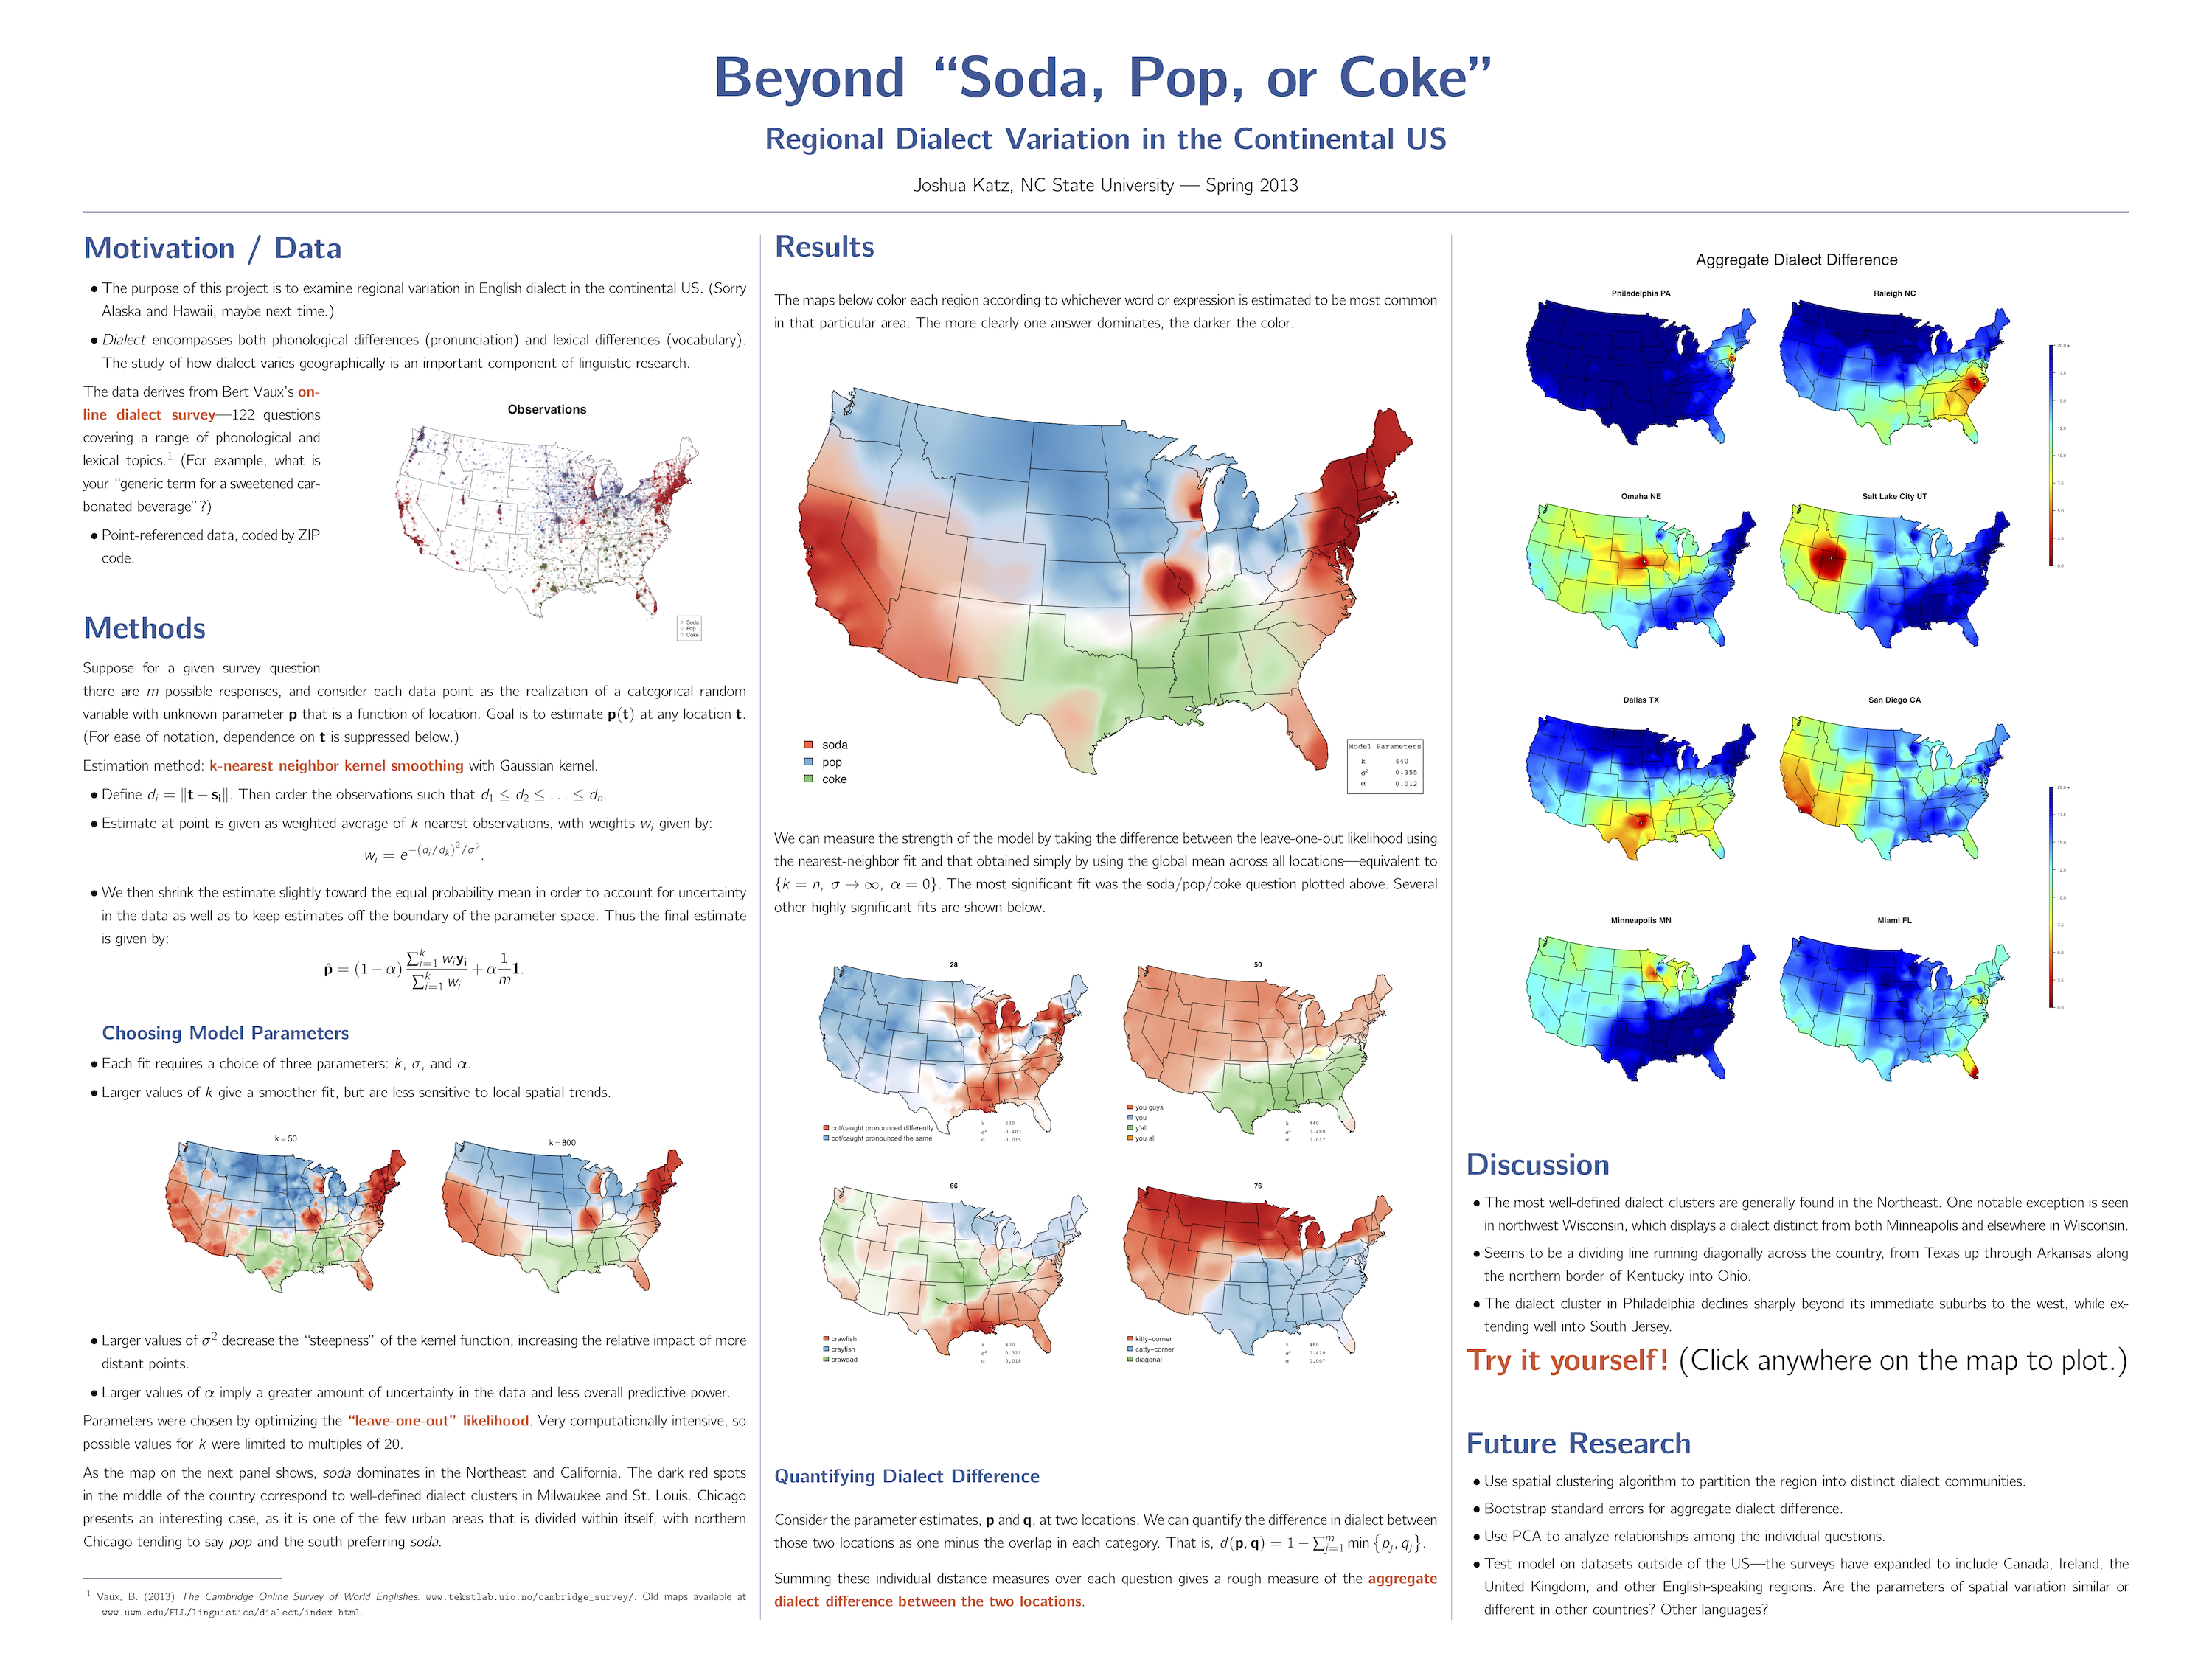
PhD student Joshua Katz mapped vernacular across America, such as words used to address a group of people, and followed up with a dialect quiz that gave you a probability that someone in an area of the United States would understand your local tongue.
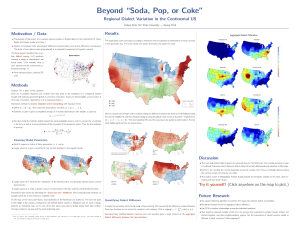
http://spark.rstudio.com/jkatz/SurveyMaps/
- Artist/Designer
http://stamen.com/datavisualizationStamen is a design and technology studio in San Fransisco that builds maps and data visualizations.
- Visualization Tool
visual.lyVisually’s mission is to help create visual content that rises above the noise. Their platform seamlessly connects designers, journalists, animators and developers with clients, featuring cloud-based collaboration tools that allow them to deliver high-quality content at unprecedented scale and speed.
- Data Collection Tool
NumbersNumbers has everything you need to organize data, perform calculations, and manage lists. And you can do it all with just a few taps on any apple device.
- Discussion Forum
http://gizmodo.com/the-best-data-visualizations-of-2013-1485611407A discussion of the best data visualizations of 2013.
- Criticism
http://www.informationisbeautiful.net/blog/A blog that discusses info graphics and data visualizations.
- Data Source:
http://www.infochimps.comInfoChimps is an organisation that has developed a data supermarket. The platform hosts over 15.000 datasets from 200 different organisations and companies. Visitors can use these datasets to combine them with their own datasets for additional insights.
- Data Ethics
Data Mining: Where Legality and Ethics Rarely Meet
http://www.ecommercetimes.com/story/52616.htmlNews of data breaches and mortgage applicants being categorized as “risky” when inaccurate credit info and commercial demographic profiles are merged has finally made consumers aware of data mining.
- A Book
Harris and co-author Sep Kamvar released We Feel Fine: An Almanac of Human Emotion, a remarkable book exploring the 12 million human emotions recorded since 2005 through brilliantly curated words and images that make this massive repository of found sentiment incredibly personal yet incredibly relatable. From despair to exhilaration, from the public to the intimate, it captures the passions and dreams of which human existence is woven through candid vignettes, intelligent infographics and scientific observations.