What Graphic Design Is
Q: What is your definition of design?
A: A plan for arranging elements in such a way as to best accomplish a particular purpose.
— Charles Eames, Design Q&A Video Transcript
Graphic Design addresses purposes related to communication through visual media.
- Inform London Tube Map
- Entertain Saul Bass Movie Titles
- Promote AIGA Poster
- Persuade We Can Do It!
- Sell 1960’s VW Ad Campaign
- Deceive 2000 Florida Ballot
How Communication Works
With appologies to Ferdinand de Saussure, et al.
- Sender has Meaning they wish to convey to Receiver
- Sender expresses Meaning as Message
- Sender conveys Message to Receiver
- Receiver interprets Message, Context, and Noise as Meaning
- Receiver has new Meaning
Communication is difficult because meaning is not transmitted directly and meaning is always changed through expression and interpretation.
The Role of the Designer
Graphic designers express meaning visually.
The designer’s goal is to express meaning so that it will be interpreted correctly as intended. To be effective, the designer must consider the context and process through which the the Receiver will interpret the message.
Because the graphic designer expresses the meaning, they have a great deal of influence over the ultimate meaning understood by the Receiver. This is true even when the designer works with someone else’s content or raw data.
Presentation can dramatically shape how a message is interpreted:
I didn’t say she stole it.
I didn’t say she stole it.
I didn’t say she stole it.
I didn’t say she stole it.
I didn’t say she stole it.
I didn’t say she stole it.
I didn’t say she stole it.
This is true even when presenting facts:
Glass Ceiling Graph
What Data Visualization Is
Data visualization is a specific area of graphic design that addresses the visual expression of data and information.
Often, the goal of data visualization is to help the audience understand the data and recognize important features and patterns.
Imagine a study where several young cats and dogs are tested for their ability to perform a skill. The table below lists some contrived results for such a study. The table is grouped by animal and sorted by age.
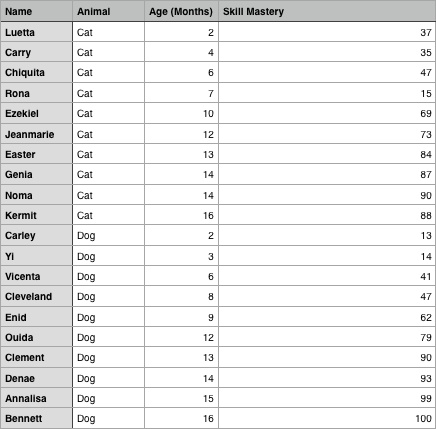
How quickly can you answer the following questions?
- Are cats or dogs better at performing the skill?
- How does performance relate to age?
- Are there any animals performing exceptionally well or poorly?
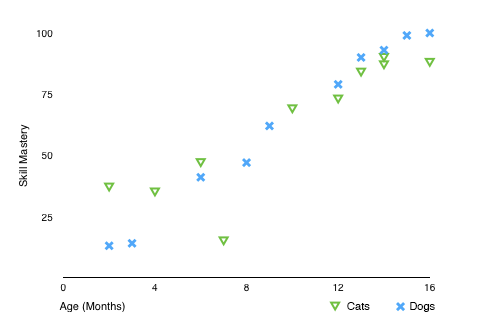
How quickly can you answer the questions by viewing the scatter plot?
Like any communication, data visualization can have a number of goals.
- Inform Gay Rights
- Entertain Movie Narrative Charts
- Promote Music Map
- Persuade An Inconvenient Truth
- Sell Warby Parker Annual Report
Some Examples of Data Visualizations
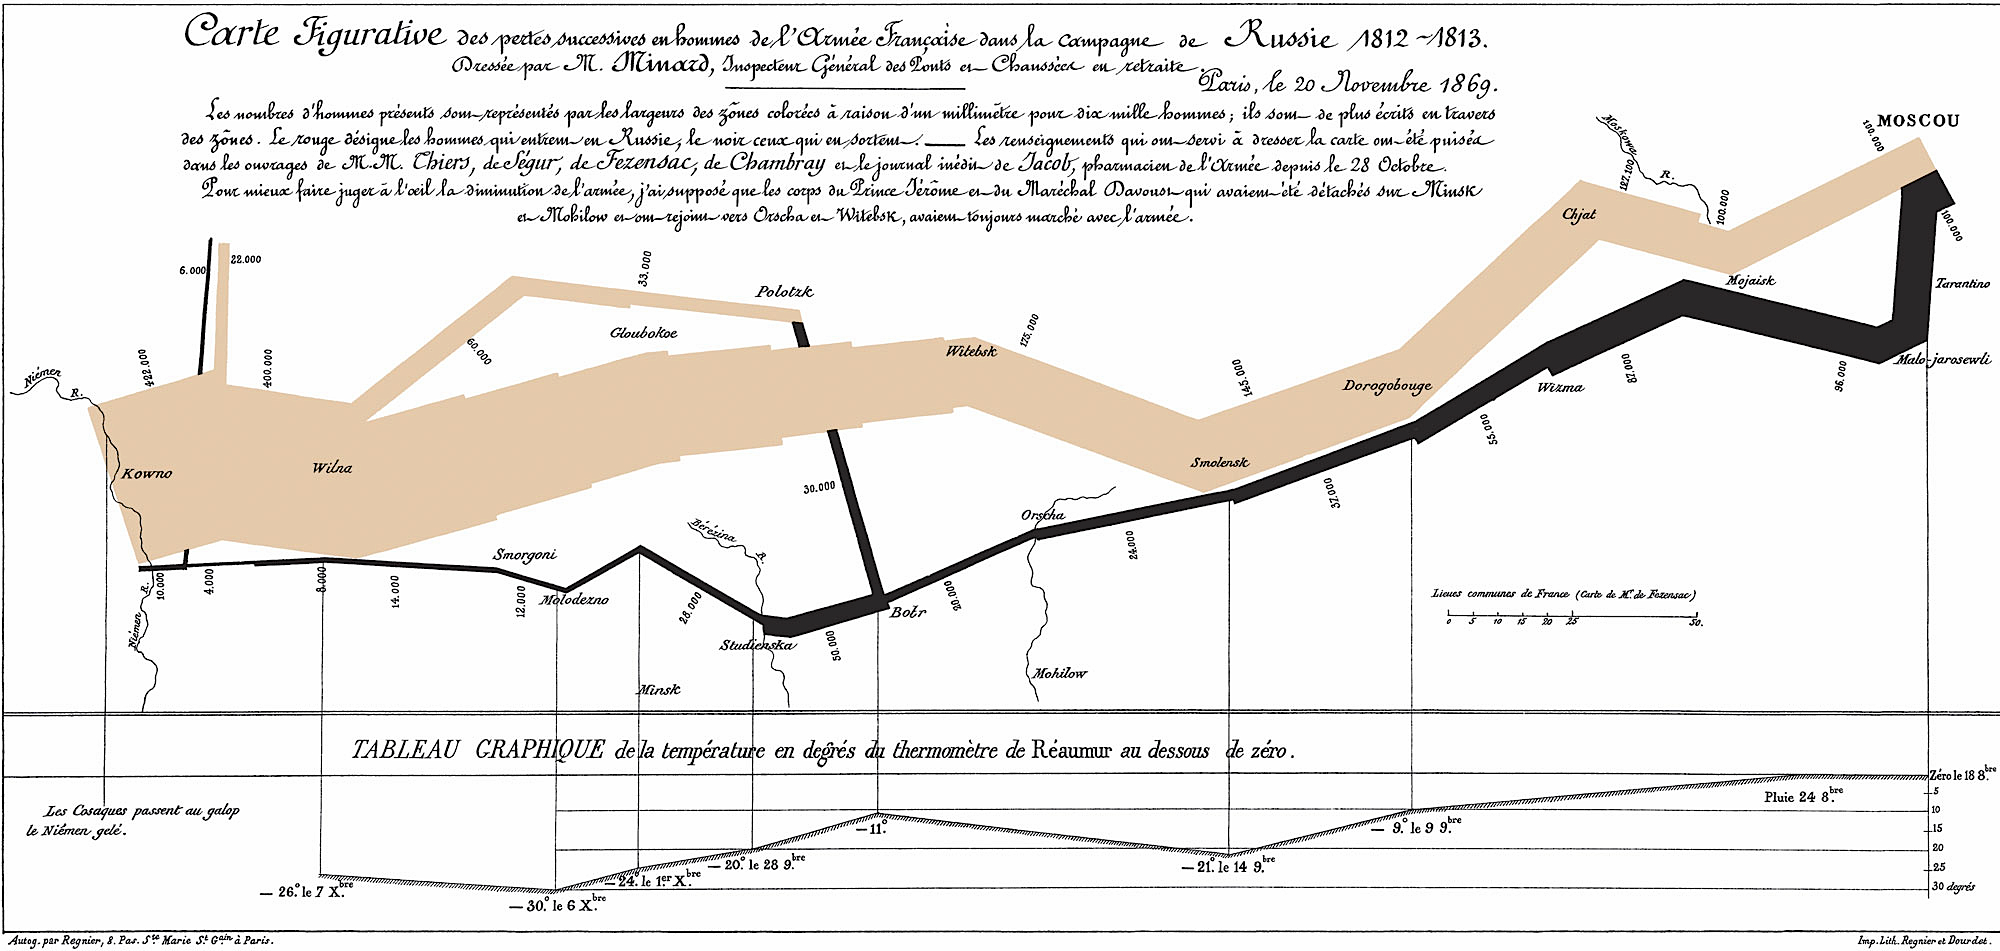
Charles Joseph Minard
“Probably the best statistical graphic ever drawn, this map by Charles Joseph Minard portrays the losses suffered by Napoleon’s army in the Russian campaign of 1812.”
Randall Munroe
Ben Fry
New York Times, Mike Bostock, Shan Carter
Accurat, Giorgia Lupi
Code in Data Visualization
Designers often employ specialized applications or custom programming in the creation of data visualizations. Using code allows you to visualize data sets that are very large and would be impossible to illustrate by hand. Using code also allows you to create designs that stay up to date with changing data and to create interactive visualizations.
Large Data Sets
Real-Time Updating
Interactive Visualizations