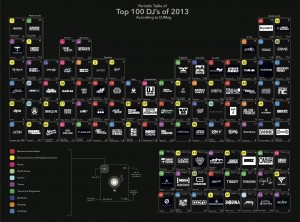
Visualizing DJ MAG Top 100
This visualization is designed in the form of a periodic table that show stye Top 100 Dj’s of 2013 as rated by DJ Mag. The ‘periods’ in the table are categorized according to countries that the DJ’s belong to while the color coded tabs indicate Genre. The ‘Noble gases’ are essentially countries that have either just one or two DJ’s who made it to the top 100.
