The subject of my web page:
I’m interested in mapping out Chicago Crime Statistics. I’m from the glorious city of Chicago and noticed a dramatic increase of crime over the last 5 years. I’m hoping that I may be able to come to some conclusions about the cause.
The data I will use:
The data set that I’m planning to use is provided by the City of Chicago to monitor chicago crime and is updated daily. The Chicago Tribune has created this API using these crime stats because the city of Chicago’s format is a little more difficult to use. The information that the API provides is the location (address, lattitude/longitude, neighborhood, ward), date, time, type of crime, description of crime, case number, whether there was an arrest, etc. The data is formatted into json, jsonp, xml, and csv.
https://data.cityofchicago.org/Public-Safety/Crimes-2001-to-present/ijzp-q8t2
http://blog.apps.chicagotribune.com/2013/03/22/announcing-the-chicago-crime-api/
My plan:
I plan to use Modest Maps (http://modestmaps.com/) to map out the city of Chicago. I will place a dot where each crime occurred. I’d like to have each type of crime mapped out on a separate map and will have a specific color dot correspond to a specific type of crime.
I’d also like to have a map that includes all types of crime so we can compare the different types and see which (if any) are more prevalent and in what areas.
A design comp of my visualization:
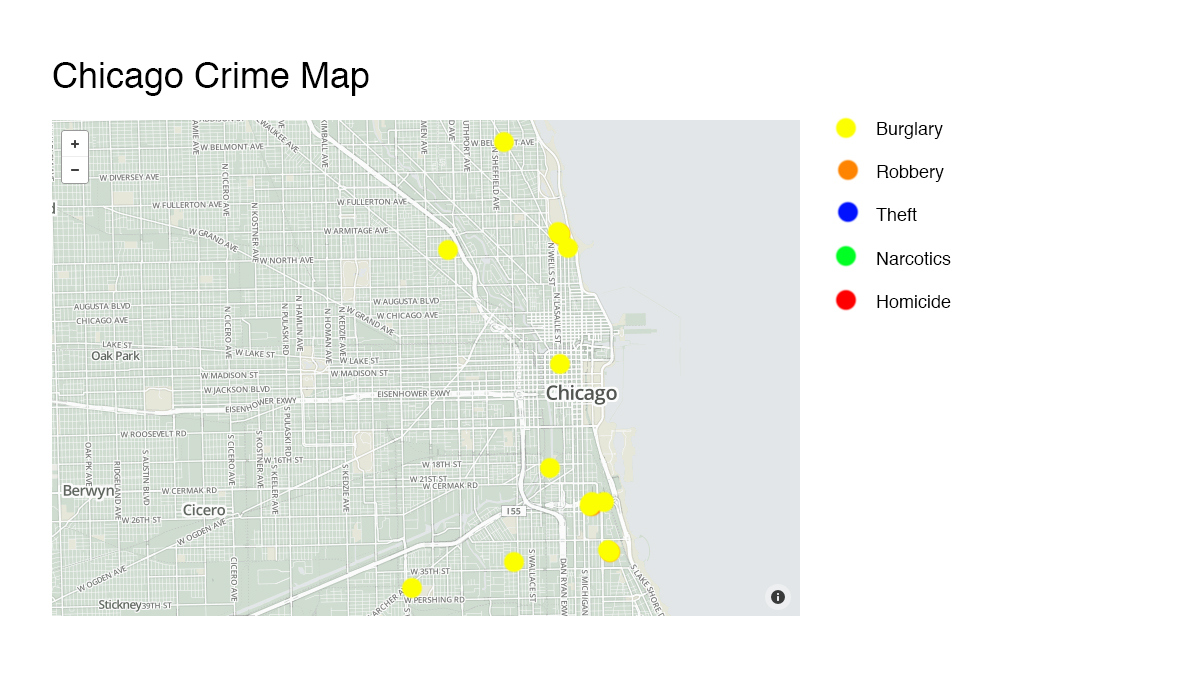
Map showing just the burglaries
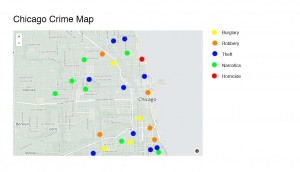
Map showing all types of crimes